Work-related fatal injuries in Great Britain 2023

At the beginning of July the Health and Safety Executive (HSE) for Britain released their figures for the number of work related fatalities with data from April 2022 up to March 2023.
During the assessment period for 2022/2023 135 workers were killed in work-related accidents in the UK, an increase of 12 from 2021/22¹.
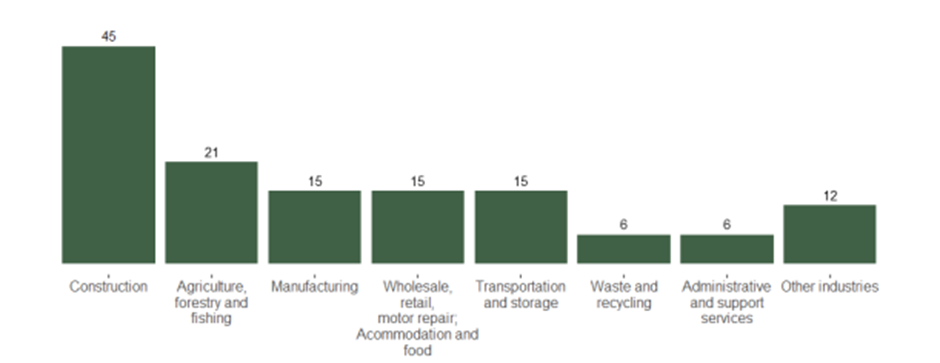
Industry Results
The industries with the highest fatality rates were Construction and Agriculture/forestry/fishing with 45 and 21 deaths respectively. Manufacturing, Wholesale/Retail/Motor repair/Accommodation/Food and Transportation/Storage each had 15 fatalities recorded². These five industries accounted for 82% of all fatalities.³
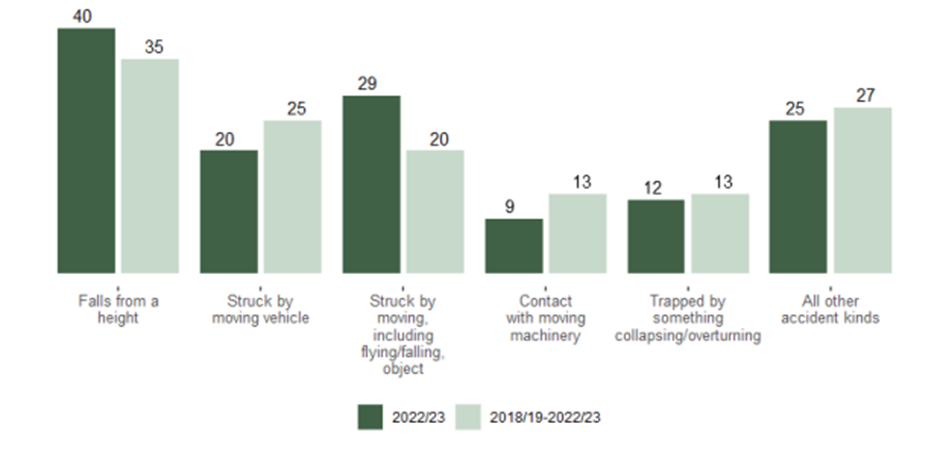
Accident Type Results
80% of all fatalities were caused by five accident types. Once again the highest cause of death is from falls from height (40) followed by being struck by a moving, including a flying/falling, object (29). 20 people were struck by a moving vehicle, 12 were trapped by something collapsing/overturning and 9 by contact with moving machinery.⁵
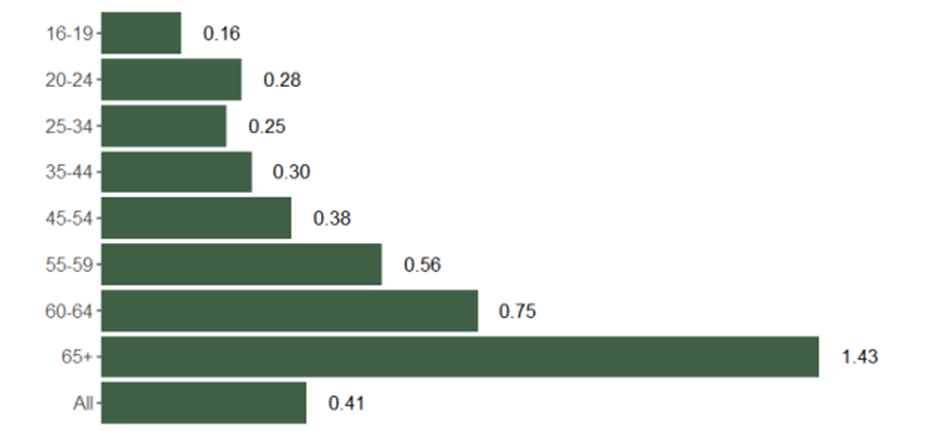
Gender and Age Results
In 2022/23, 129 (96%) of all worker fatalities were male workers, a similar proportion to earlier years (116 (94%) during 2021/22).⁷
Looking at age groups, 25% of the fatal injuries were to workers aged 60 and over even though they only represent 11% of the workforce.⁸ When broken down into specific age brackets and the rate of fatal injuries per 100,000 workers, the groups with the highest rate are 65+ (1.43), 60-64 (0.75) and 55-59 (0.56). The groups with the lowest rates of fatality per 100,000 workers are 16-19 (0.16), 25-34 (0.25) and 20-24 (0.28).⁹
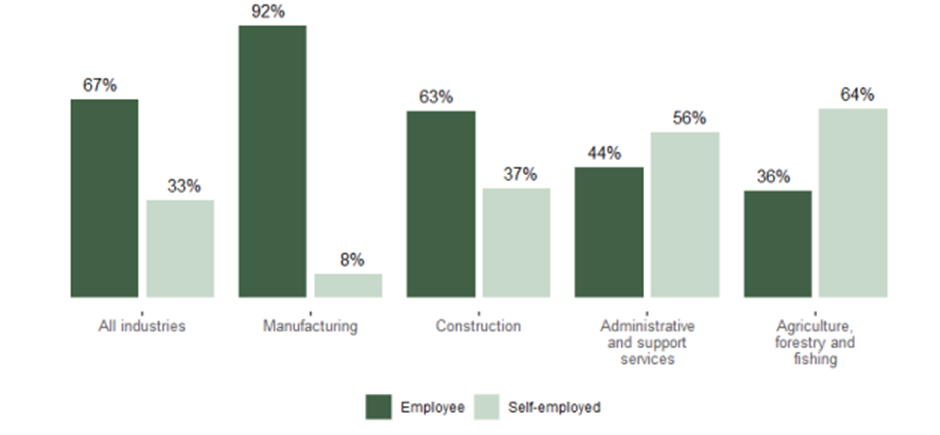
Employment Results
For the five year period 2018-2023 33% of fatal injuries occurred to self-employed workers, although they only account for around 15% of the total workforce.¹¹ Figures also show that 64% of those who died in the Agriculture/forestry/fishing industries were self-employed workers.¹²
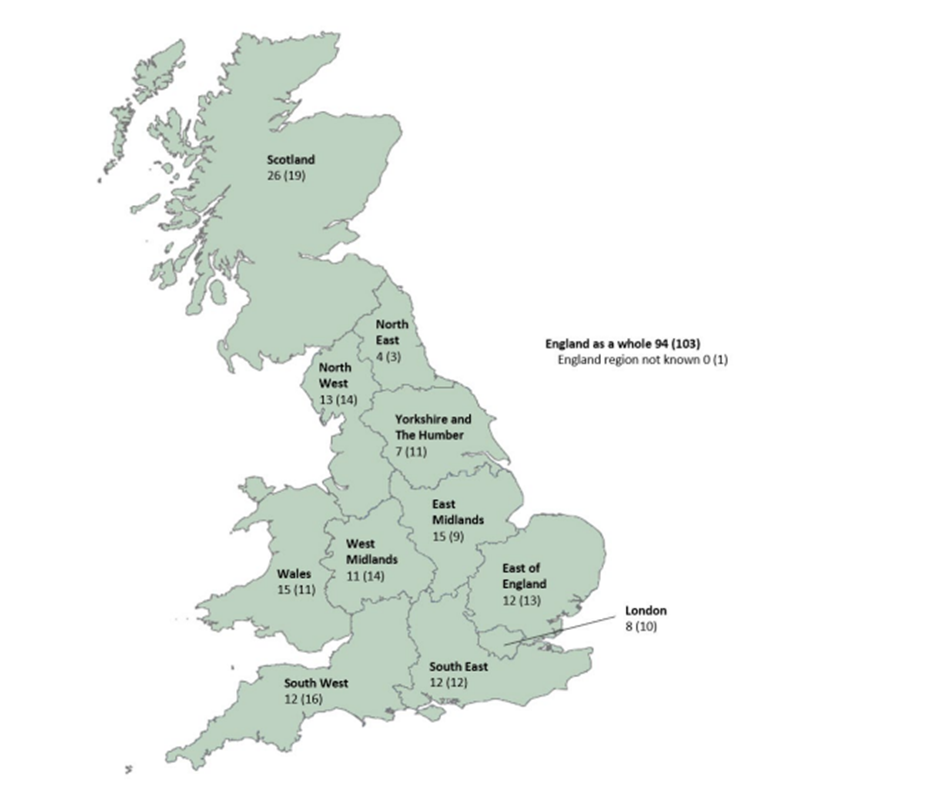
Country and Regional Results
Using the fatal injury rate per 100,000 workers England has a lower injury rate than either Scotland or Wales. However, injury rates are strongly influenced by variations in the mix of industries and occupations and in England there are a greater proportion of people working in lower risk jobs than in Scotland and Wales.¹⁴
Trends Over Time
Although there has been an increase of 12 deaths from the previous years’ data, the fatal injury rate per 100,000 deaths has remained largely stable over the last ten years. The rate for 2020/21 was 0.44 deaths per 100,000 workers, followed by 0.38 deaths per 1000,000 for 2021/22. ¹⁶ The 135 fatalities for 2022/23 means a fatal injury rate of 0.41 deaths per 100,000 workers. ¹⁷
1, 2, 3, 4, 5, 6, 8, 9, 10, 11, 12, 13, 14, 15, 17 - Work-related fatal injuries in Great Britain, 2023, Health and Safety Executive
7, 16 - Work-related fatal injuries in Great Britain, 2022, Health and Safety Executive


Stacey Manclark
As an expert in lone worker content management, I possess an extensive knowledge base and experience in the area of lone working and safety monitoring. My expertise in this field encompasses a wide range of areas, including risk assessment, training, communication, and technology. I have a deep understanding of the unique risks associated with lone workers and have researched and written many projects and articles to educate people in how to mitigate these risks.
Throughout my time with OK Alone, I have kept up to date with technological developments, legislative changes and regulations that have been introduced to help organizations ensure the safety of their lone workers.
Book a Demo Today
Alternatively, get a free trial of the app
Want to try OK Alone? Click the button below and enter your details. It's free and no credit card is required.